Introducing NiamonX Radar: Real-Time Threat Intelligence for the Real World
Cyber threats rarely arrive as clean, structured reports.
They appear as a forum post. A Telegram message. A database dump. A screenshot. A ransomware listing. A nickname used by the same actor across different sources. A domain mentioned once, then again, then again in a completely different context.
For analysts, SOC teams, researchers, and security leaders, the hard part is not only finding the signal. The hard part is connecting it fast enough to matter.
That is why we built NiamonX Radar.
NiamonX Radar is an AI-powered Threat Intelligence and OSINT platform designed to monitor real-world cyber threats, track exposed data, profile threat actors, map relationships between intelligence records, and help teams understand what is happening before a threat becomes their incident.
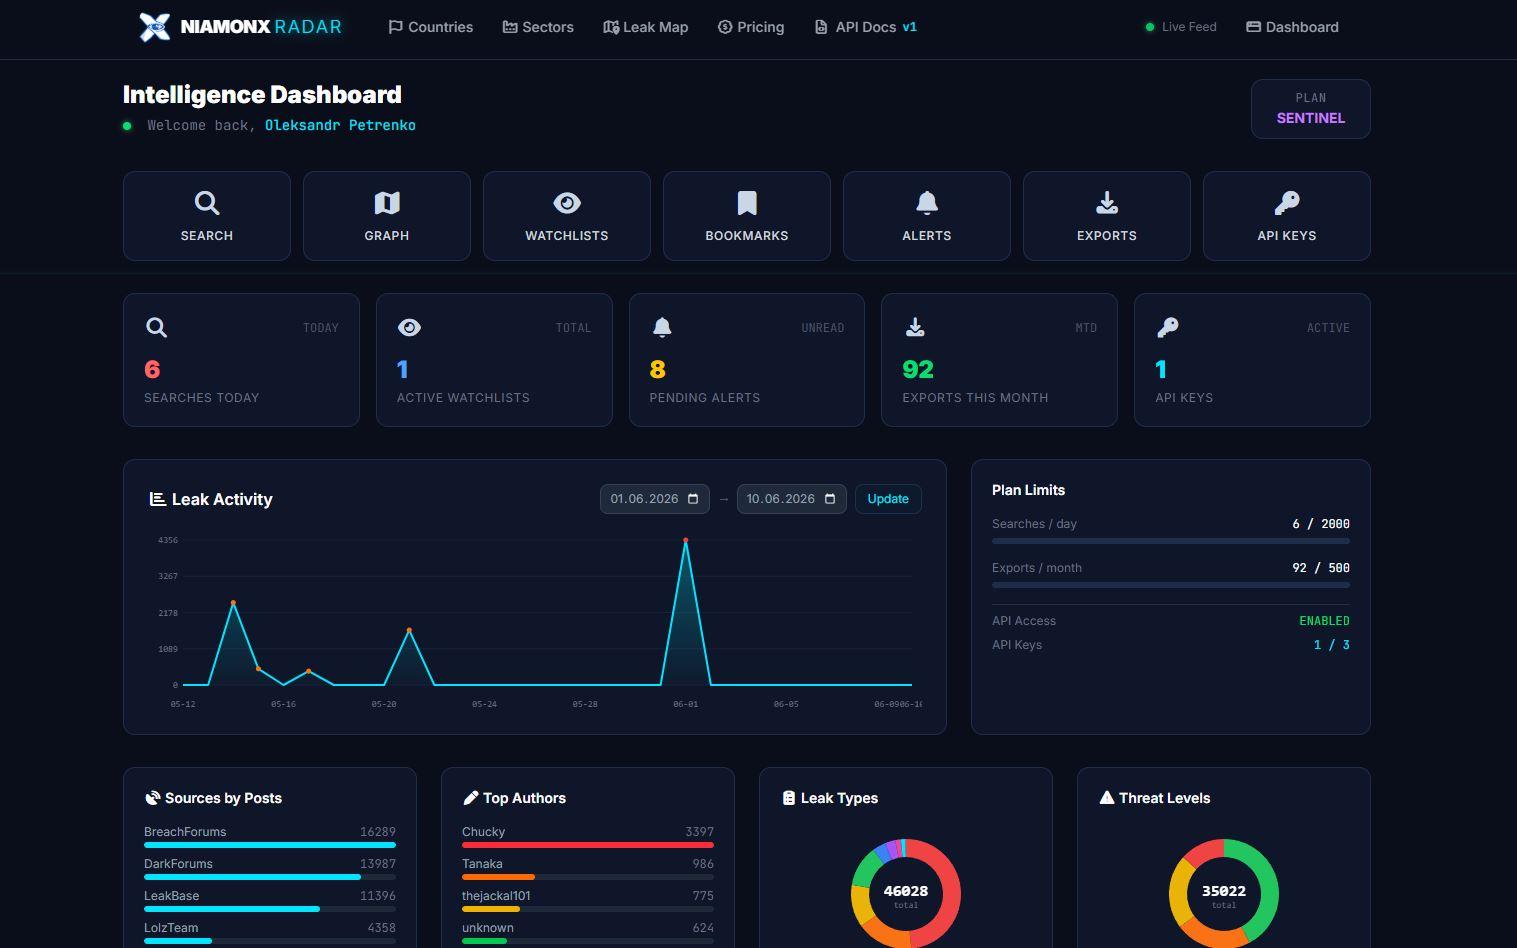
Caption: The NiamonX Radar Intelligence Dashboard gives analysts one place to search, investigate, monitor alerts, manage exports, and work with API keys.
Why Radar exists
Most security teams already have tools. SIEMs, EDRs, vulnerability scanners, ticketing systems, dashboards, internal reports, threat feeds, spreadsheets, and manual notes.
But external threat intelligence often still feels fragmented.
One source shows a leak. Another source mentions an actor. A third source contains a possible IOC. Someone on the team checks a forum manually. Another person searches Telegram. A researcher saves screenshots locally. A report is written hours later, sometimes after the opportunity for early response has already passed.
Radar was created to reduce that gap.
It brings together threat actor intelligence, leak monitoring, country and sector intelligence, graph-based investigation, AI-assisted analysis, alerts, exports, and API integrations inside a single intelligence workspace.
The goal is simple: help teams move from scattered cyber data to clear, actionable intelligence.
A live intelligence feed, not a static database
Radar is built around a live view of threat activity.
The platform continuously monitors relevant cyber threat sources and turns raw findings into structured intelligence records. In the live feed, analysts can see new incidents with threat levels, countries, sectors, leak types, authors, sources, and timestamps.
This matters because threat intelligence has a time problem.
A database leak discovered today is more valuable than the same leak discovered three weeks later. A ransomware post seen in the first minutes gives defenders more room to prepare. A credential exposure detected early can lead to faster password resets, account reviews, and incident containment.
Radar is designed for this kind of speed.
Caption: The live intelligence feed shows recent threat records with severity, country, sector, leak type, source attribution, and publication date.
In the feed, records are classified by severity such as Critical, High, Medium, or Low/Unknown. This gives analysts a practical way to triage noise and focus first on the records that may require immediate attention.
Search across leaks, actors, IOCs, and organizations
Threat intelligence work often starts with a question.
Has our company appeared in a leak?
Is this actor connected to other campaigns?
Are there exposed credentials related to a client domain?
Which incidents affected Germany this week?
Where else has this IOC appeared?
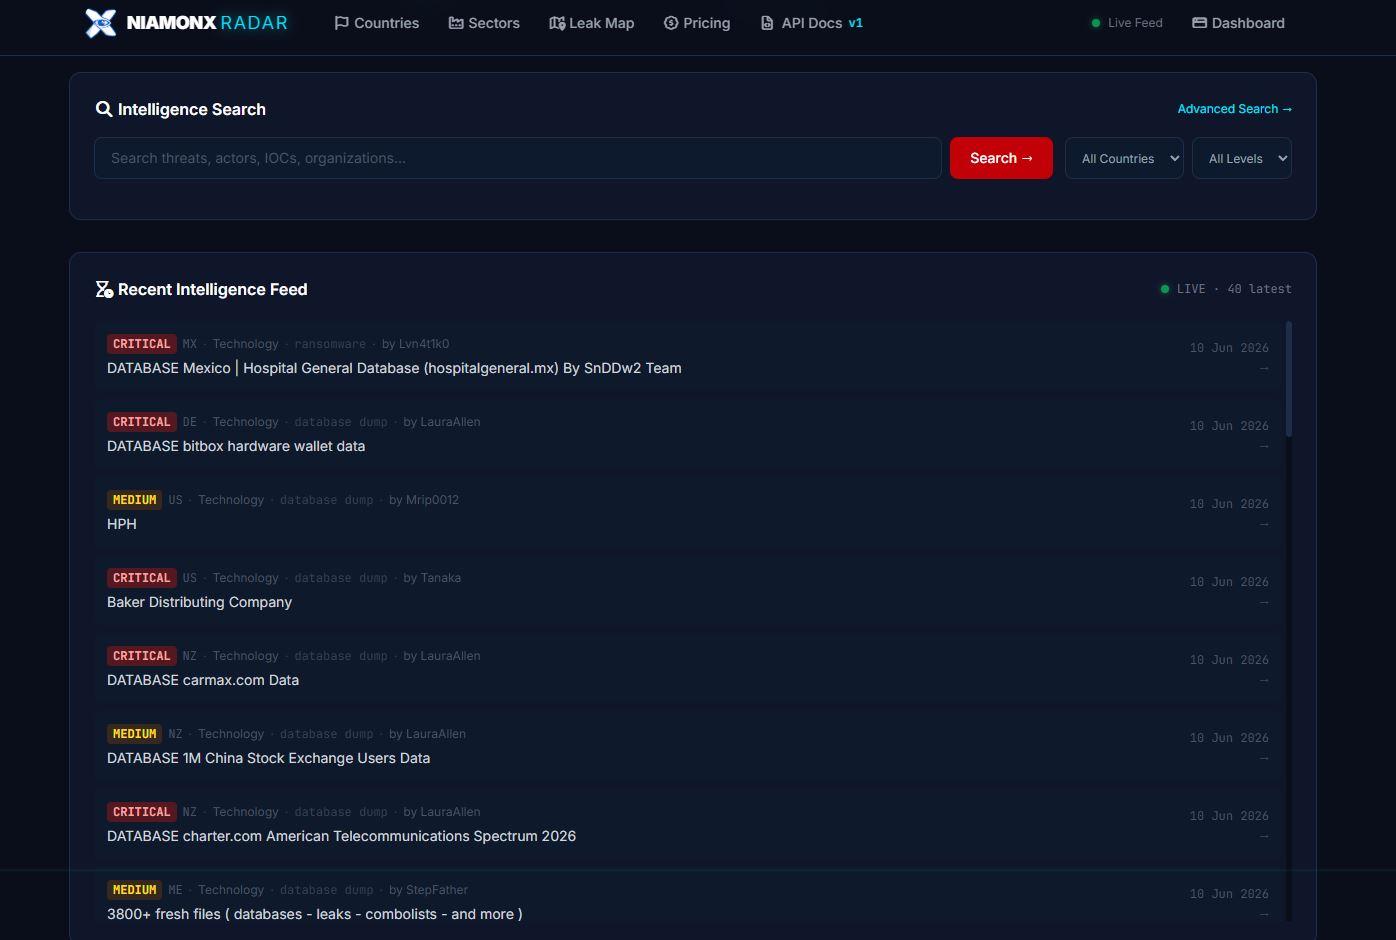
Radar includes an intelligence search interface built for this workflow.
Analysts can search across leak records, threat actors, IOCs, organizations, author handles, keywords, tags, countries, sectors, threat levels, types, and dates. The interface supports both broad discovery and focused investigation.
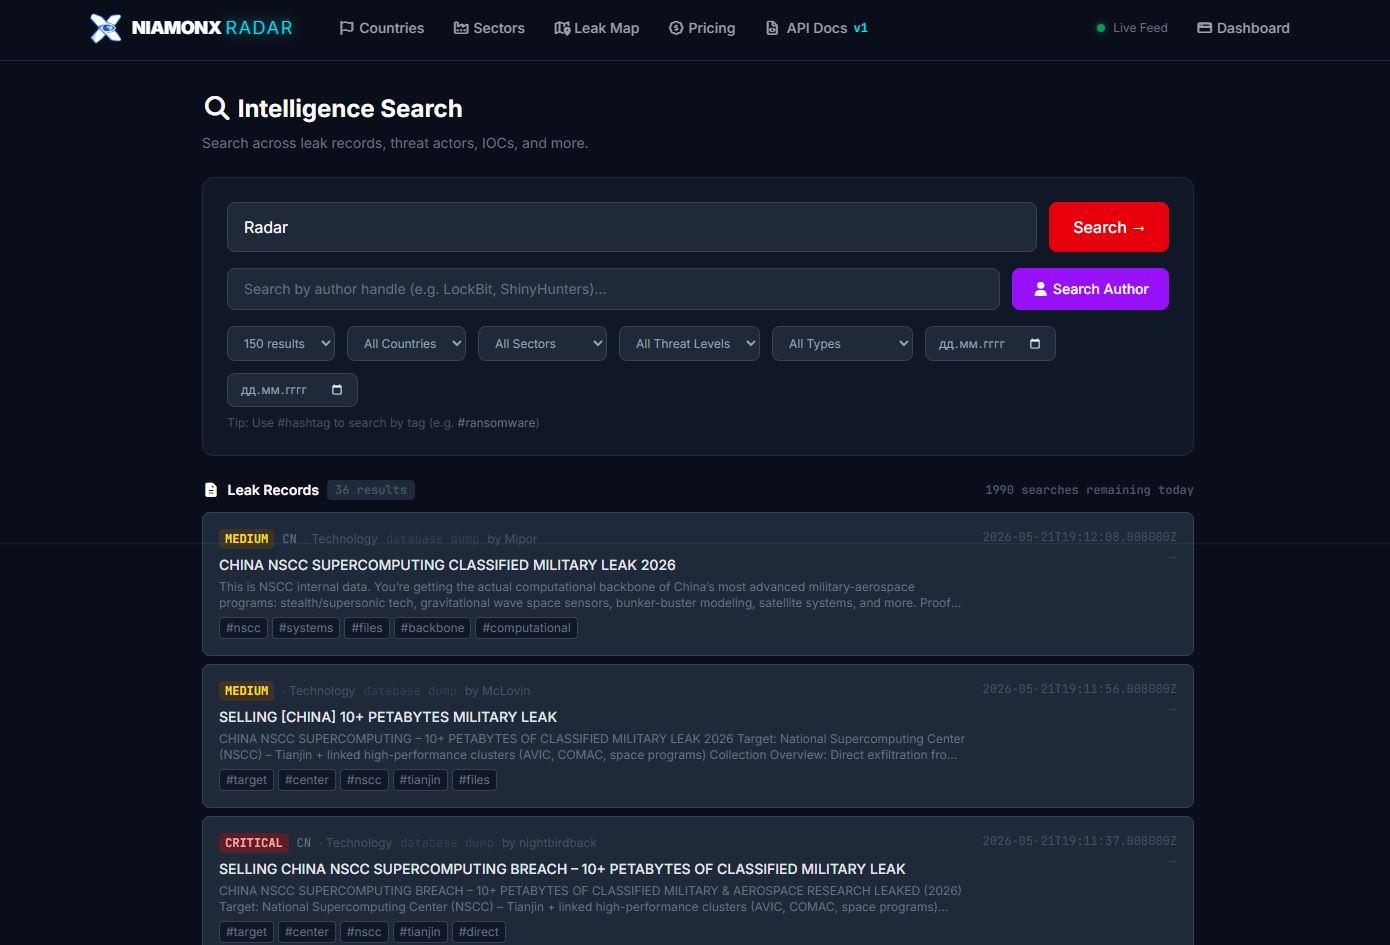
Caption: Intelligence Search allows analysts to search across leak records, threat actors, IOCs, authors, countries, sectors, threat levels, types, and dates.
The search experience is designed to be fast and practical. An analyst can start with a simple keyword, then narrow the results using filters. For example, a search can be limited to a specific country, sector, threat level, leak type, or time period. Author-based search helps when tracking repeated activity from the same handle.
This is important because real investigations rarely follow a straight line. You start with one clue, then pivot.
Radar is built for that pivot.
Country intelligence: understanding geographic exposure
Cyber incidents do not exist in isolation. Geography often matters.
A company may care most about Germany, the United States, the United Kingdom, Ukraine, France, or another region where it operates. A government agency may need to understand country-level exposure. A managed security provider may need to monitor risk across multiple client regions.
Radar includes a dedicated Countries section that shows threat intelligence coverage by country.
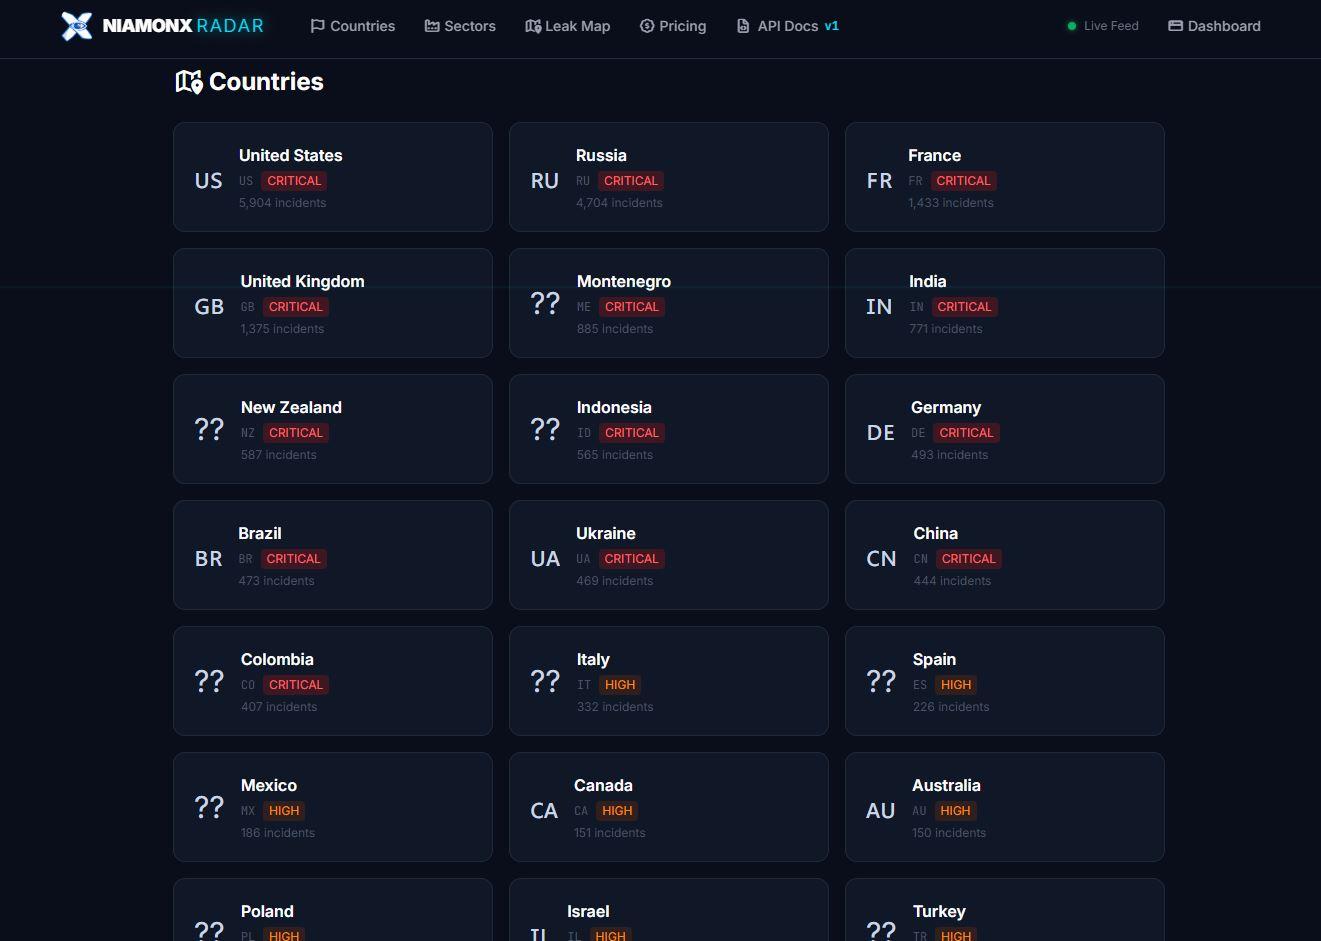
Caption: The Countries view shows country-level intelligence coverage, incident volume, and risk classification across monitored regions.
From the country overview, users can quickly see which countries currently have the highest number of incidents and what risk level is assigned. The interface displays countries such as the United States, Russia, France, the United Kingdom, India, Germany, Ukraine, China, Brazil, Italy, Spain, Mexico, Canada, Australia, and others.
Opening a country gives a deeper operational view.
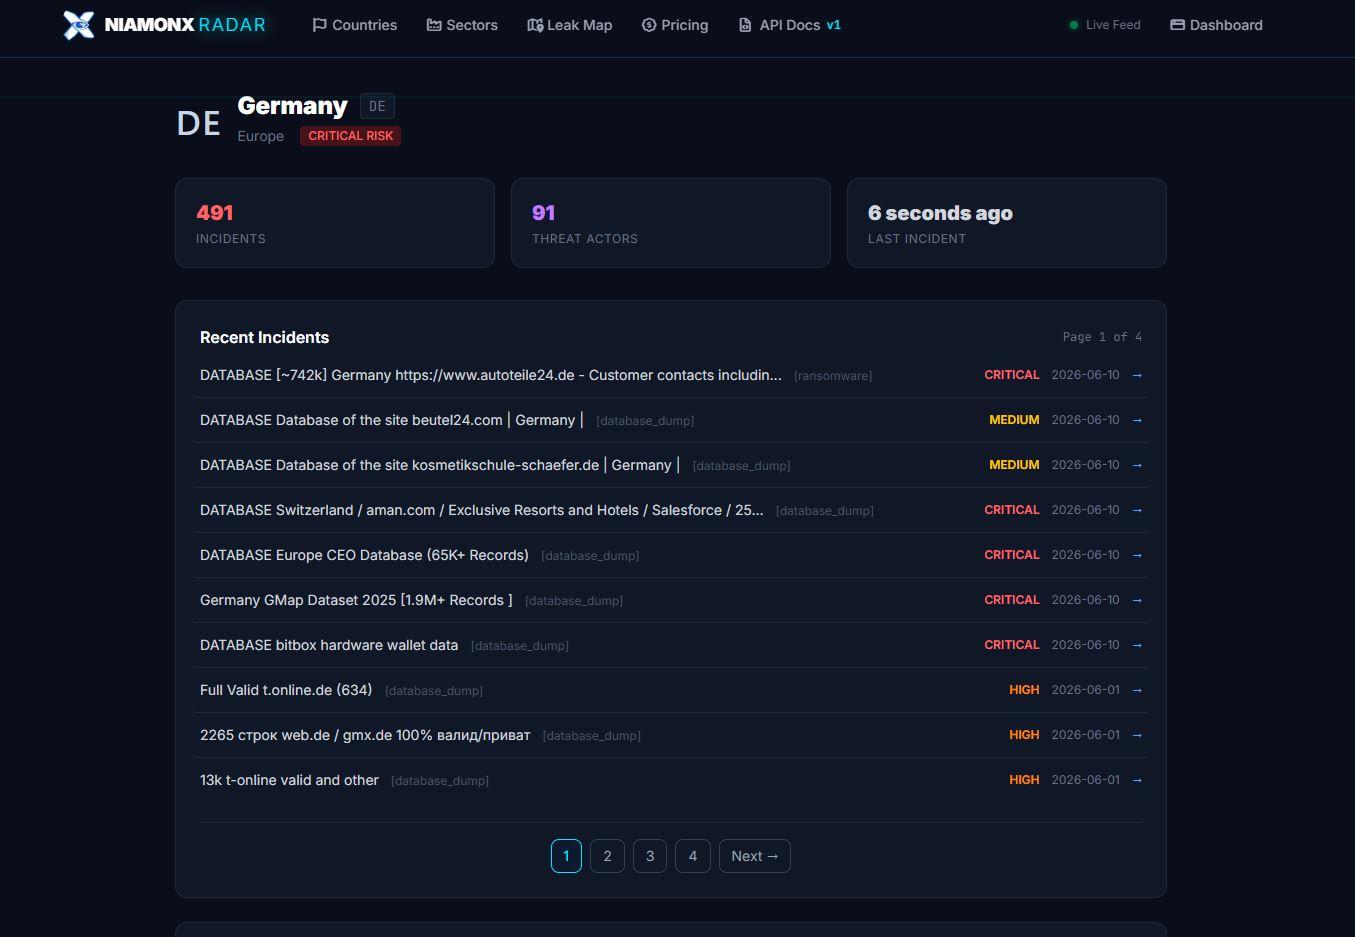
Caption: A country profile, such as Germany, shows incident count, tracked threat actors, last incident time, and recent intelligence records.
For example, a country intelligence page can show the number of incidents, tracked actors, latest activity, and a list of recent records. This helps analysts quickly answer a very practical question: “What is happening in this region right now?”
Sector intelligence: seeing which industries are being targeted
Threats also cluster by industry.
Technology companies see developer leaks, exposed API keys, infrastructure disclosures, source code exposure, credential dumps, and supplier risks. Financial services face fraud, account access, phishing infrastructure, and data exposure. Healthcare organizations face ransomware, patient data leaks, and operational disruption. Government entities face espionage, credential theft, document exposure, and disinformation risks.
Radar includes Industry Sectors to make this easier to analyze.
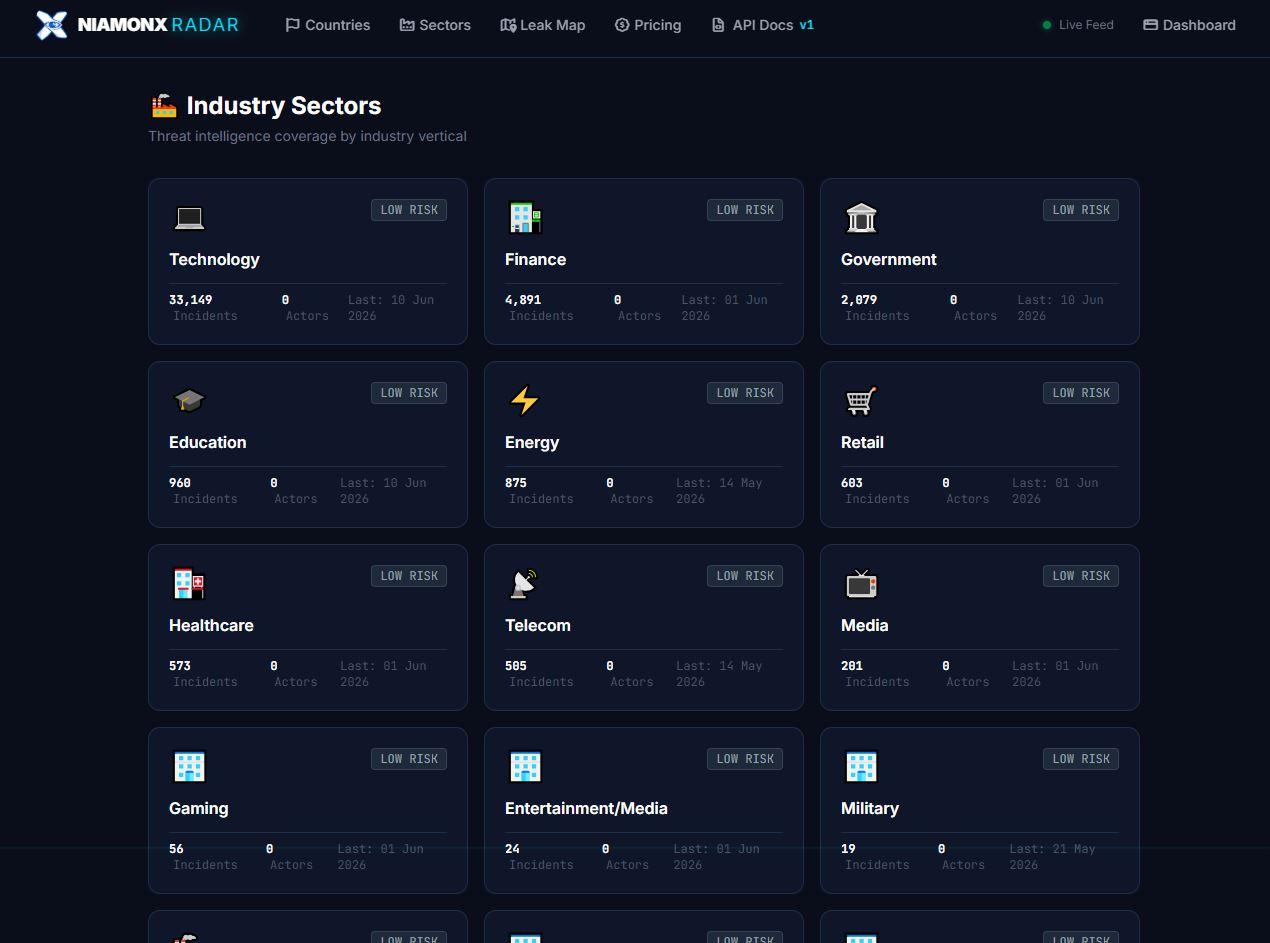
Caption: Industry Sectors gives a quick view of threat intelligence coverage across technology, finance, government, education, energy, retail, healthcare, telecom, media, gaming, and military sectors.
The sector overview shows incident counts, actor counts, last activity, and risk level by vertical. This helps teams focus on the industries that matter to them.
A deeper sector page provides recent incidents inside that vertical.
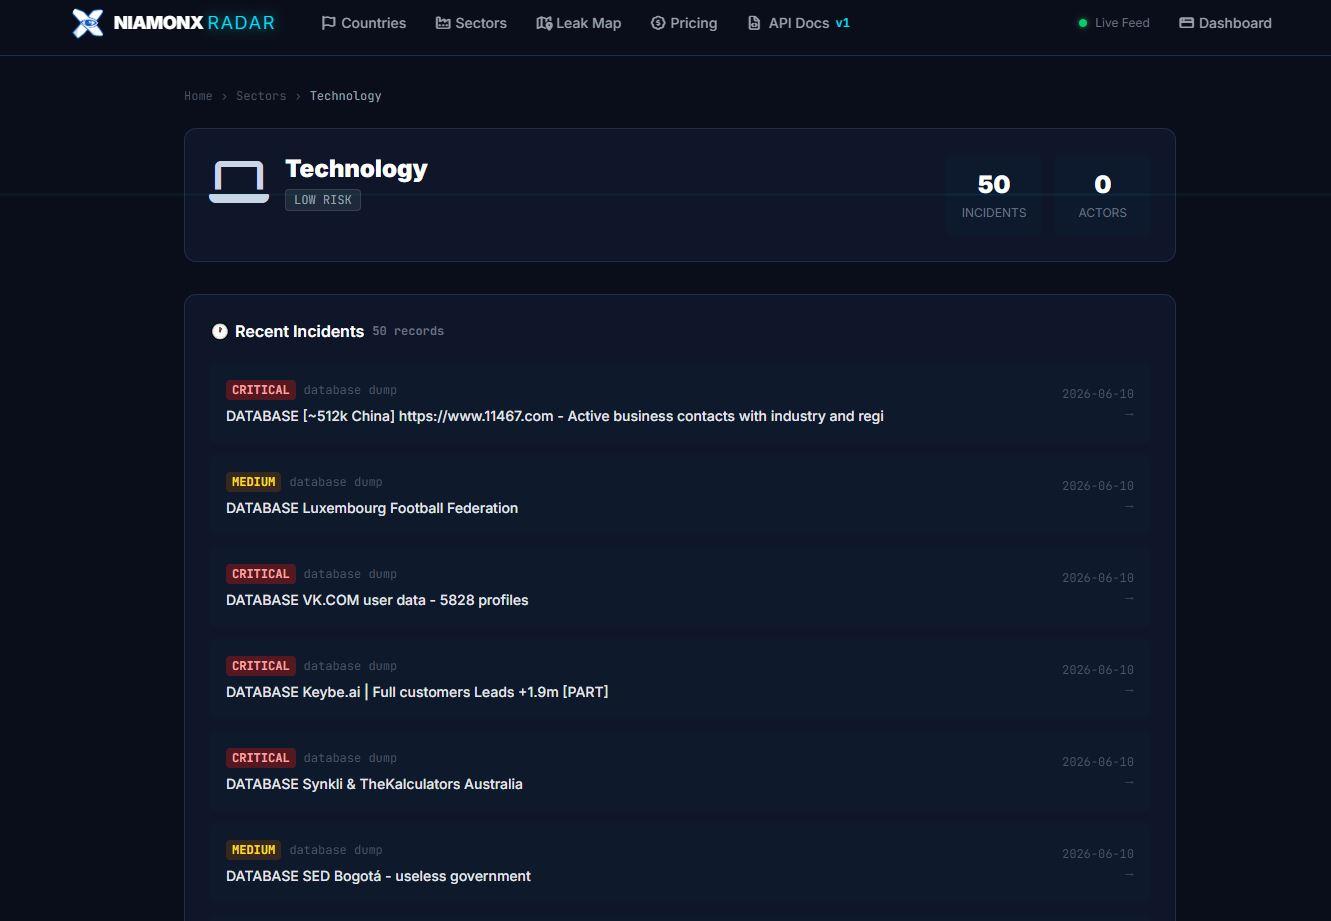
Caption: A sector profile, such as Technology, provides a focused list of recent incidents related to that industry.
This is especially useful for enterprise security teams, MSSPs, consultants, and researchers who need to answer sector-specific questions: Which industries are currently exposed? What types of leaks are appearing? Are certain actors repeatedly targeting the same vertical?
Global Leak Map: threat intelligence with geographic context
Sometimes a table is not enough.
Radar includes a Global Leak Map that visualizes data breach incidents across the world. Dots on the map represent incidents, and colors show severity: Critical, High, Medium, or Low/Unknown.
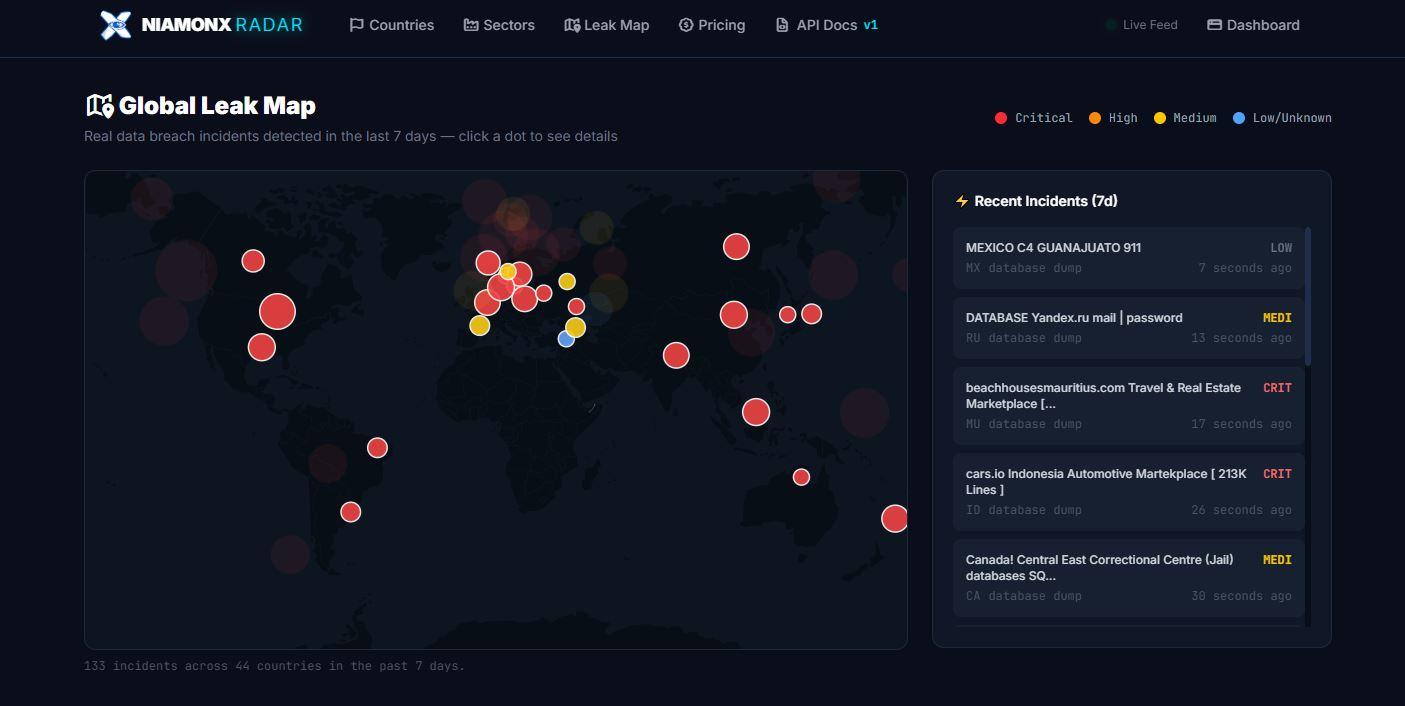
Caption: Global Leak Map visualizes recent breach activity across countries and highlights severity with color-coded incidents.
The map helps users quickly understand geographic distribution. It is useful for executive overviews, regional monitoring, and fast situational awareness.
Instead of reading through hundreds of records, a user can immediately see where new incidents are appearing and which regions are currently more active.
The side panel shows recent incidents over the selected period, giving analysts a bridge between visual overview and detailed investigation.
Threat actor profiles: more than a name
A threat actor is not just a nickname.
A useful actor profile should tell a story: when the actor appeared, what they usually publish, what sectors they target, which countries are affected, what tactics they use, and how their activity changes over time.
Radar includes actor profiles for this reason.
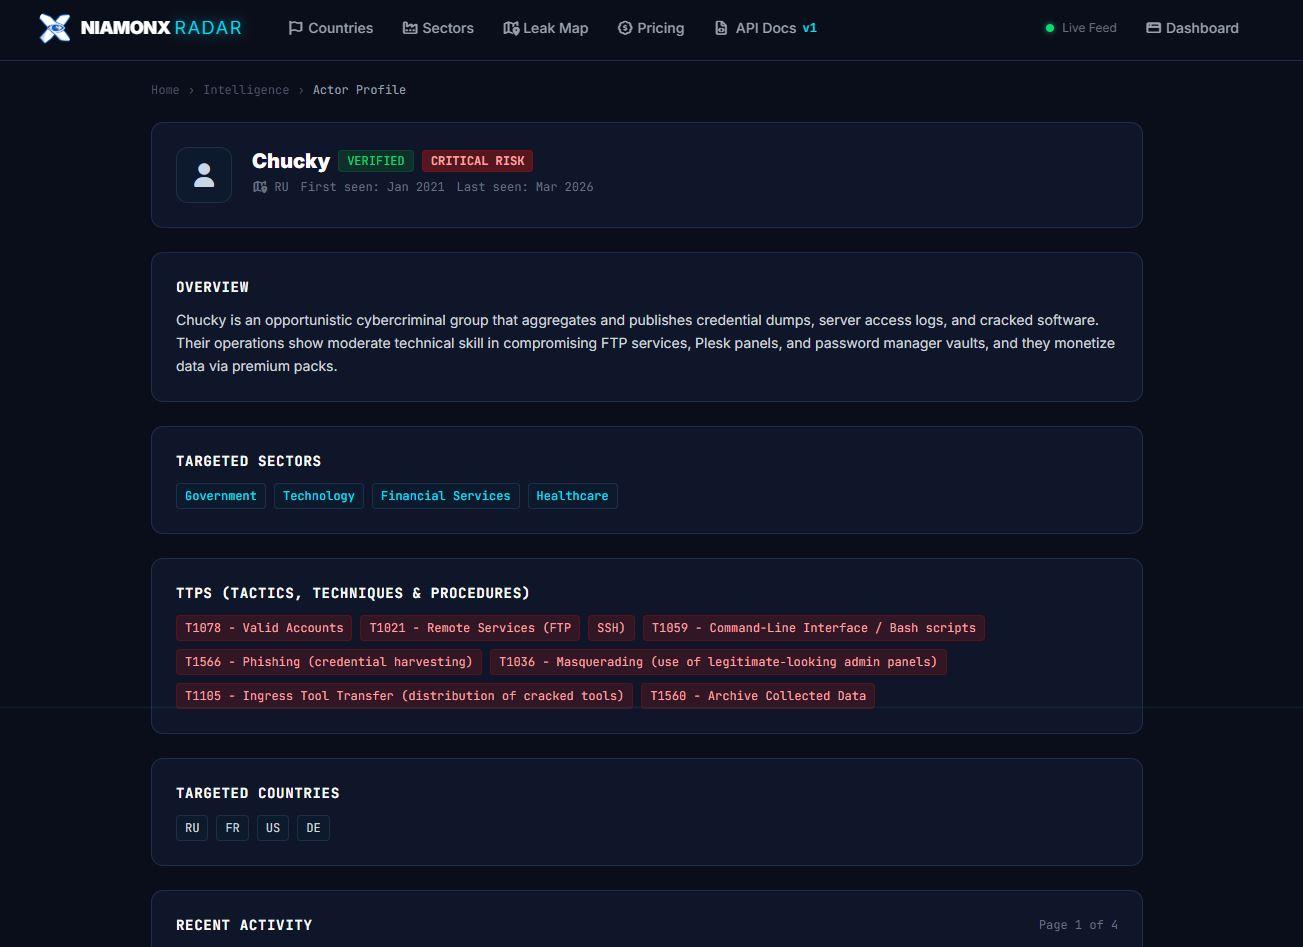
Caption: Actor profiles show risk level, verification status, first seen and last seen dates, targeted sectors, targeted countries, TTPs, and recent activity.
In the actor profile view, analysts can see details such as verification status, risk level, country attribution where available, first seen and last seen dates, targeted sectors, targeted countries, and recent activity.
The profile also includes TTPs — tactics, techniques, and procedures — mapped in a way that helps analysts understand behavior rather than only reading descriptions.
For example, an actor profile may include techniques such as valid accounts, remote services, phishing, masquerading, command-line interface usage, ingress tool transfer, or archive collected data.
This helps teams move beyond “who posted this?” and toward “how does this actor operate?”
Leak reports with AI-assisted context
One of the most important parts of Radar is the leak report page.
A raw post is often messy. It may contain screenshots, vague claims, partial samples, author comments, tags, external links, and inconsistent formatting. Analysts need to extract what matters: what was exposed, who may be affected, how serious it is, where it came from, and what to do next.
Radar structures this information into a readable leak report.
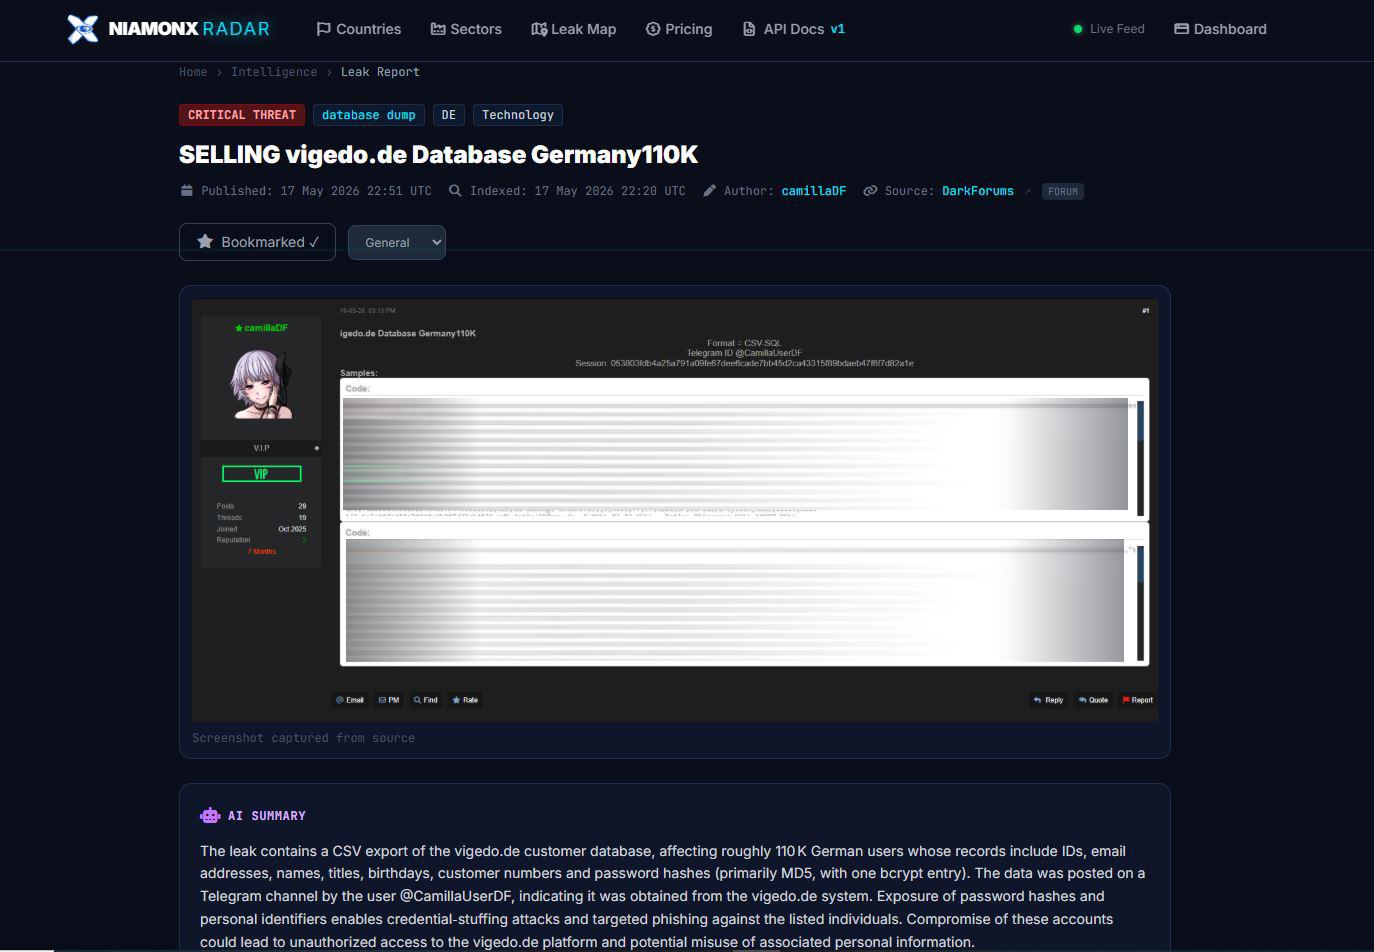
Caption: A leak report shows the threat level, leak type, affected country and sector, publication time, indexed time, author, source, evidence screenshot, and AI summary.
Each leak report can include threat level, leak type, country, sector, publication date, indexed date, author, source, tags, captured evidence, AI summary, AI classification, and links to related investigation tools.
The AI summary is designed to save time. Instead of forcing the analyst to manually interpret the entire source content, Radar provides a structured explanation of the record and its potential impact.
The AI classification can include fields such as threat level, leak type, sector, and confidence score.
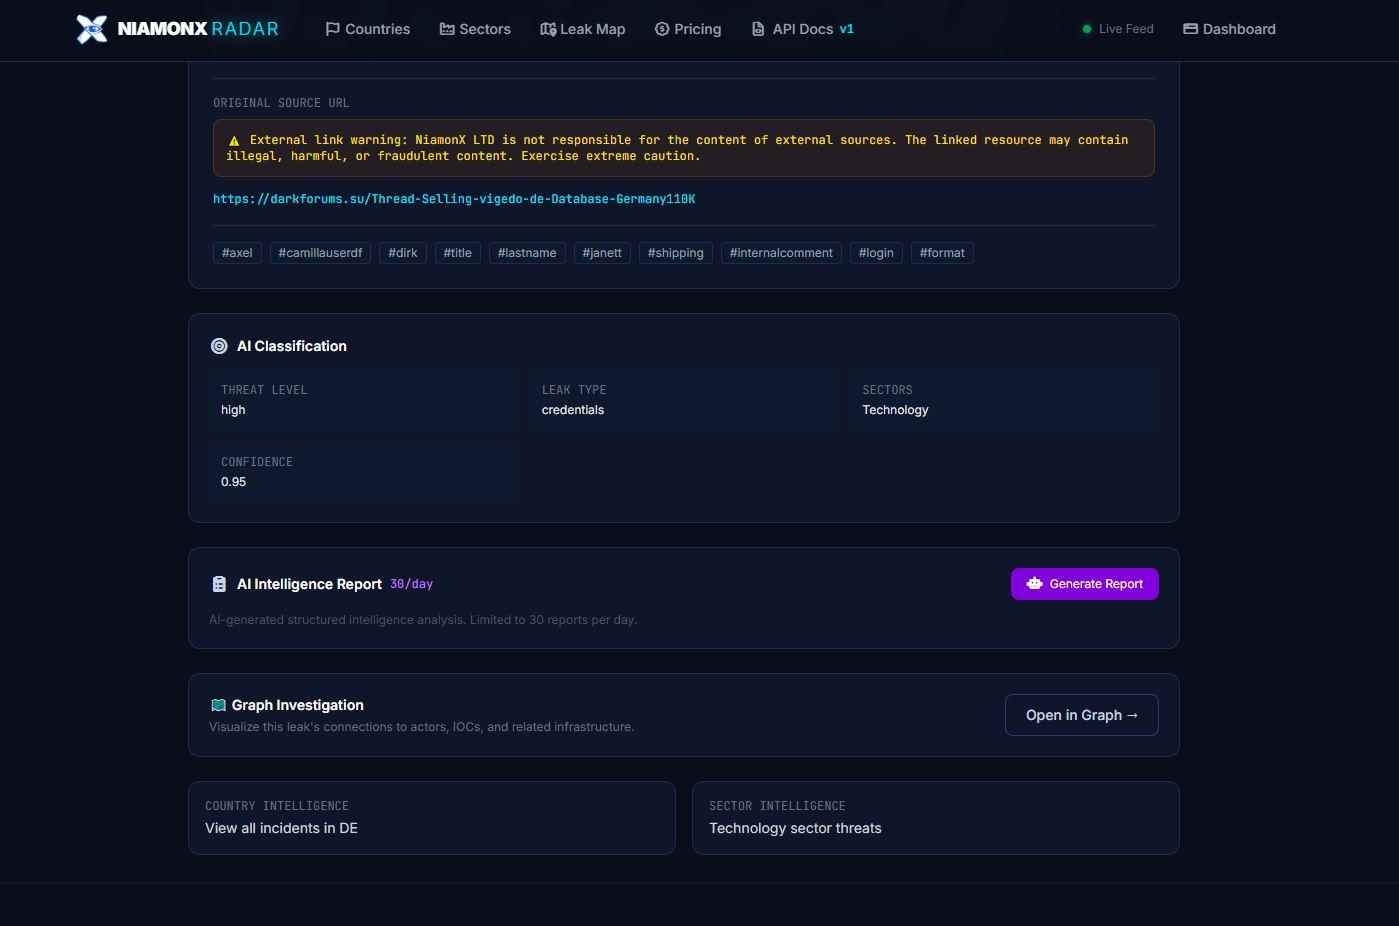
Caption: AI Classification and AI Intelligence Report help analysts classify, summarize, and document an incident faster.
Radar also includes an AI Intelligence Report function, allowing users to generate structured intelligence analysis from a record. This can help with internal reporting, client communication, incident response workflows, and case documentation.
Graph Investigation: connect the dots visually
Threat intelligence becomes much more powerful when relationships are visible.
A single post may be connected to an actor. That actor may be connected to other posts. Those posts may mention domains, organizations, wallets, hashes, usernames, or infrastructure. A pattern may appear only when these objects are viewed together.
Radar includes Graph Investigation to make this possible.
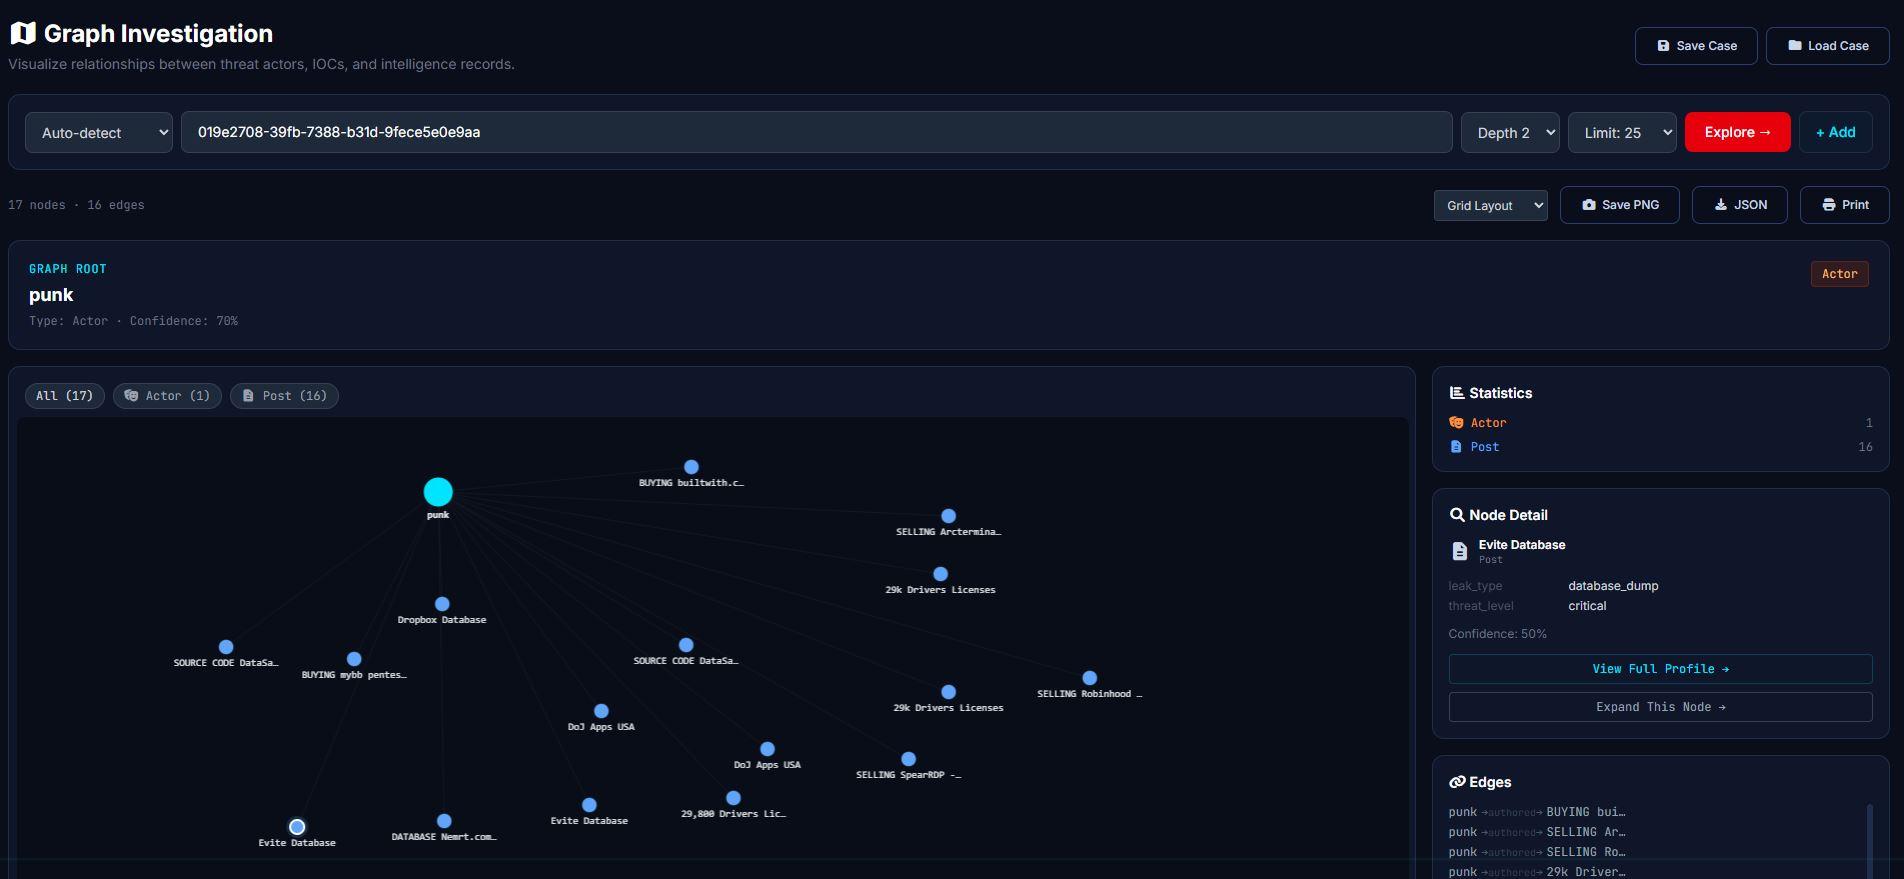
Caption: Graph Investigation visualizes relationships between actors, posts, IOCs, leaks, and intelligence records.
The graph interface allows analysts to start from an entity, auto-detect its type, choose exploration depth, set limits, expand nodes, inspect details, and save the case.
The graph view includes nodes, edges, statistics, node details, and export options such as PNG and JSON. Analysts can also save and load cases, which is useful when investigations continue over multiple sessions.
This is one of the key reasons Radar is more than a search interface.
Search helps you find records.
Graph Investigation helps you understand relationships.
Watchlists and alerts: continuous monitoring for what matters
Not every investigation starts manually.
Sometimes you already know what you need to monitor: a company name, a domain, a country, an actor, an IOC, a keyword, or a sector.
Radar includes watchlists so users can monitor selected intelligence targets continuously.
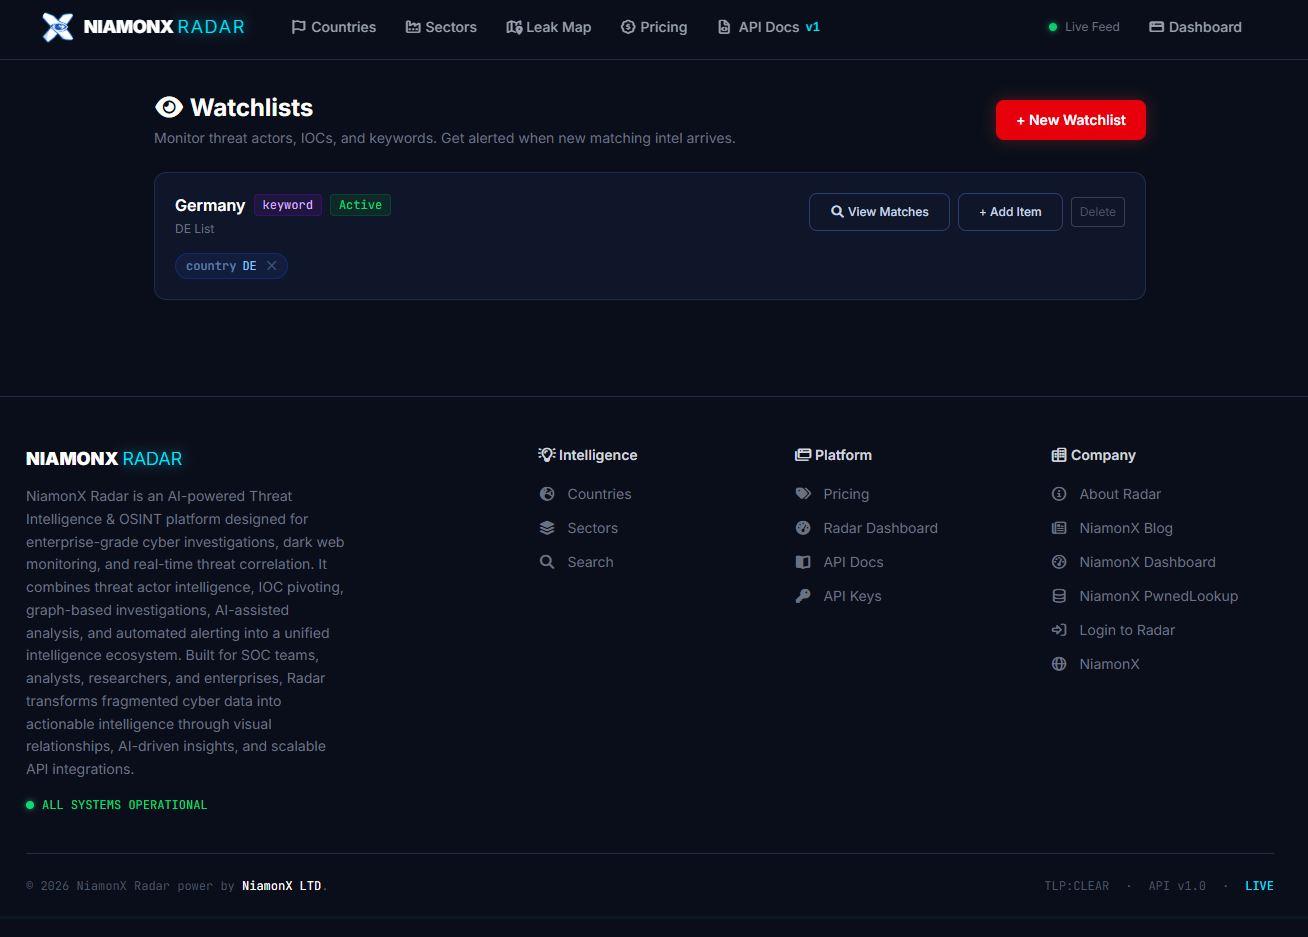
Caption: Watchlists allow users to monitor keywords, countries, actors, IOCs, and other intelligence targets.
A watchlist can be created for a keyword or country, such as Germany, and then used to view matching intelligence. This helps teams stay informed when new relevant records appear.
Alerts make this even more useful. Instead of repeatedly running the same searches, teams can monitor what matters and react when new intelligence arrives.
This is especially valuable for:
- company domain monitoring;
- executive and employee exposure monitoring;
- country-specific monitoring;
- sector-specific monitoring;
- threat actor tracking;
- client risk monitoring;
- incident follow-up;
- continuous SOC workflows.
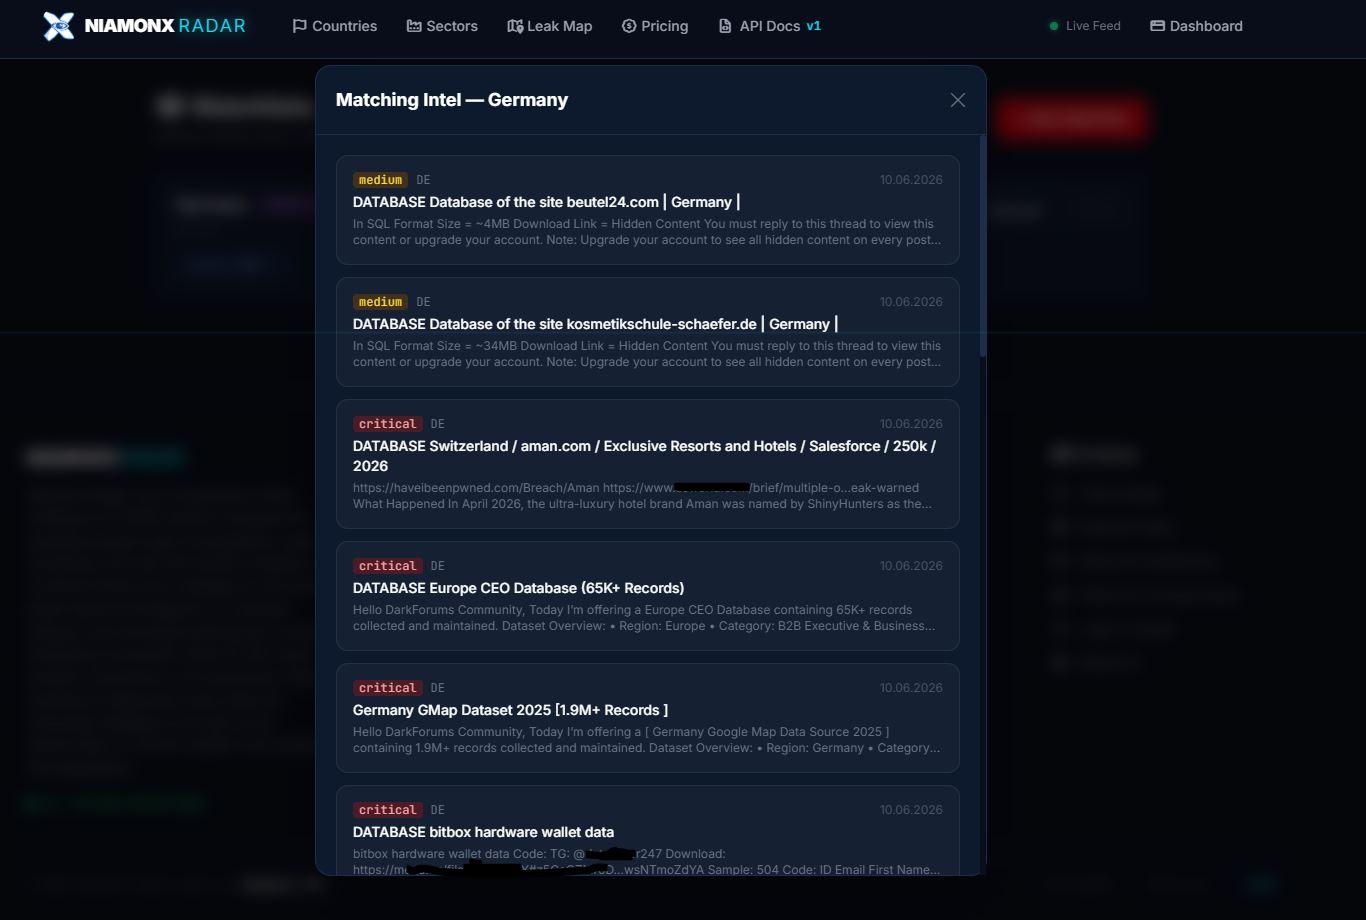
Caption: Matching Intel shows watchlist results for a selected monitoring target, helping analysts quickly review new relevant records.
Built for analysts, SOC teams, researchers, and enterprises
Radar was designed for practical cyber intelligence work.
For SOC teams, it provides real-time threat visibility, alerts, triage, exports, and API access.
For threat intelligence analysts, it provides actor profiles, graph investigation, IOC pivoting, AI summaries, country intelligence, sector intelligence, and structured reporting.
For researchers, it provides a workspace to explore relationships, track sources, monitor activity, and document findings.
For enterprises, it provides a scalable intelligence layer that can support brand monitoring, third-party risk, incident response, executive reporting, and security operations.
The platform also includes API keys and REST API access for integrations, making it possible to connect Radar intelligence to internal tools, SIEM/SOAR workflows, dashboards, enrichment pipelines, and automated monitoring systems.
Why use NiamonX Radar?
Because speed matters.
Because context matters.
Because a leak is not just a leak — it may be connected to an actor, a campaign, an industry, a country, an IOC, or a larger pattern.
Because analysts should not have to spend hours copying information between tabs, screenshots, spreadsheets, and reports.
Because threat intelligence is only useful when it can be searched, understood, connected, monitored, exported, and acted on.
Radar brings those steps together.
It gives teams a live feed for visibility, search for discovery, actor profiles for context, country and sector intelligence for prioritization, leak reports for analysis, AI summaries for speed, graph investigation for relationships, watchlists for monitoring, alerts for reaction, exports for reporting, and API access for automation.
A platform for the next stage of NiamonX
NiamonX has always been built around one idea: intelligence should be practical.
Not just data.
Not just dashboards.
Not just isolated tools.
Practical intelligence means giving users the ability to understand risk, verify signals, investigate relationships, and make better decisions.
NiamonX Radar is a major step in that direction.
It is built for the real world of cyber investigations, where data is messy, time is limited, and the difference between early awareness and late discovery can be critical.
Radar helps teams see what is happening, understand why it matters, and act before the situation becomes worse.
Final thoughts
Cybersecurity does not need more noise.
It needs better context.
NiamonX Radar was created to turn fragmented cyber threat data into structured, searchable, visual, and actionable intelligence. It gives analysts a place to monitor the threat landscape, investigate incidents, track actors, understand exposure, and build intelligence workflows that scale.
The result is a platform that feels less like another feed — and more like a real intelligence workspace.
NiamonX Radar is now part of the NiamonX ecosystem.
Explore it, test it, monitor what matters, and see how much faster cyber intelligence becomes when the right context is already connected.